Introduction
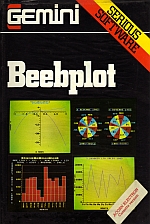
Beebplot is a data portrayal program written for the Acorn Electron and making full use of high resolution graphics and colour options. Essentially, its function is to provide an easily assimilated visual representation of numerical data of any kind.
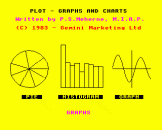
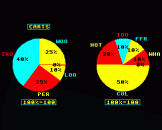
For example, say you have prepared an estimate of costs for building a house extension. All you have at this stage is a large amount of figures which are difficult to comprehend quickly. If you entered your data into Beebplot then you could have your costings presented to you in pie chart, histogram or graph format - in full colour and high resolution. If you also have an Epson or other similar bit-image compatible printer then you can perform a high-resolution screen dump of your chart in seconds using Beebplot's built-in machine code screen dump.
Beebplot will also interface to existing Gemini software packages such as Beebcalc and Cashbook. It is a most useful program in education and also contains a mathematical function plotting facility - in fact, it will provide the means for hours of interesting and constructive computing for any serious micro user.
For further instructions on Beebplot, please refer to the accompanying User Guide.


